EMA Power BandsHello!
Today, I am delighted to introduce you to the "EMA Power Bands" indicator, designed to assist in identifying buying and selling points for assets moving in the markets.
Key Features of the Indicator:
EMA Bands: "EMA Power Bands" utilizes Exponential Moving Average (EMA) to create trend lines. These bands automatically expand or contract based on the price trend, adapting to market conditions.
ATR-Based Volatility: The indicator measures price volatility using the Average True Range (ATR) indicator, adjusting the width of the EMA bands accordingly. As a result, wider bands form during periods of increased volatility, while they narrow during lower volatility.
RSI-Based Buy-Sell Signals: "EMA Power Bands" uses the Relative Strength Index (RSI) to identify overbought and oversold zones. Entering the overbought zone generates a sell signal, while entering the oversold zone produces a buy signal.
Trend Direction Identification: The indicator assists in determining the price trend direction by analyzing the slope of the EMA bands. This allows you to identify periods of uptrends and downtrends.
Visualization of Buy-Sell Signals: "EMA Power Bands" visually marks the buy and sell signals:
- When RSI enters the overbought zone, it displays a sell signal (🪫).
- When RSI enters the oversold zone, it indicates a buy signal (🔋).
- When a candle closes above the emaup line, it displays a bearish signal (🔨).
- When a candle closes below the emadw line, it indicates a bullish signal (🚀).
By using the "EMA Power Bands" (EMA Güç Bantları) indicator, especially in trend-following strategies and periods of volatility, you can make more informed and disciplined trading decisions. However, I recommend using it in conjunction with other technical analysis tools and fundamental data.
*You can also use it with CCI as an example.
With this indicator, you can identify potential trend reversals in advance and strengthen your risk management strategies.
So, go ahead and try the "EMA Power Bands" (EMA Güç Bantları) indicator to enhance your technical analysis skills and make more informed trading decisions!
"relative strength"に関するスクリプトを検索

Variety Step RSI w/ Dynamic Zones [Loxx]Variety Step RSI w/ Dynamic Zones is a stepped RSI calculation with Discontinued Signal Lines. This indicator includes 7 types of RSI to choose from. The addition of the Discontinued Signal Lines allows this indicator to better identify momentum shifts in price so traders have better defined long/short signals.
Enhanced Moving Average Calculation with Stepped Moving Average and the Advantages over Regular RSI
Technical analysis plays a crucial role in understanding and predicting market trends. One popular indicator used by traders and analysts is the Relative Strength Index (RSI). However, an enhanced approach called Stepped Moving Average, in combination with the Slow RSI function, offers several advantages over regular RSI calculations.
█ Stepped Moving Average and Moving Averages:
The Stepped Moving Average function serves as a crucial component in the calculation of moving averages. Moving averages smooth out price data over a specific period to identify trends and potential trading signals. By employing the Stepped Moving Average function, traders can enhance the accuracy of moving averages and make more informed decisions.
Stepped Moving Average takes two parameters:
The current RSI value and a size parameter. It computes the next step in the moving average calculation by determining the upper and lower bounds of the moving average range. It accomplishes this by adjusting the values of smax and smin based on the given RSI and size.
Furthermore, Stepped Moving Average introduces the concept of a trend variable. By comparing the previous trend value with the current RSI and the previous upper and lower bounds, it updates the trend accordingly. This feature enables traders to identify potential shifts in market sentiment and make timely adjustments to their trading strategies.
█ Advantages over Regular RSI:
Enhanced Range Boundaries:
The inclusion of size parameters in Stepped Moving Average allows for more precise determination of the upper and lower bounds of the moving average range. This feature provides traders with a clearer understanding of the potential price levels that can influence market behavior. Consequently, it aids in setting more effective entry and exit points for trades.
Improved Trend Identification:
The trend variable in Stepped Moving Average helps traders identify changes in market trends more accurately. By considering the previous trend value and comparing it to the current RSI and previous bounds, Stepped Moving Average captures trend reversals with greater precision. This capability empowers traders to respond swiftly to market shifts and potentially capture more profitable trading opportunities.
Smoother Moving Averages:
Stepped Moving Average's ability to adjust the moving average range bounds based on trend changes and size parameters results in smoother moving averages. Regular RSI calculations may produce jagged or erratic results due to abrupt market movements. Stepped Moving Average mitigates this issue by dynamically adapting the range boundaries, thereby providing traders with more reliable and consistent moving average signals.
Complementary Functionality with Slow RSI:
Stepped Moving Average and Slow RSI function in harmony to provide a comprehensive trading analysis toolkit. While Stepped Moving Average refines the moving average calculation process, Slow RSI offers a more accurate representation of market strength. The combination of these two functions facilitates a deeper understanding of market dynamics and assists traders in making better-informed decisions.
What is a Discontinued Signal Line (DSL)?
Many indicators employ signal lines to more easily identify trends or desired states of the indicator. The concept of a signal line is straightforward: by comparing a value to its smoothed, slightly lagging state, one can determine the current momentum or state.
The Discontinued Signal Line builds on this fundamental idea by extending it: rather than having a single signal line, multiple lines are used based on the indicator's current value.
The "signal" line is calculated as follows:
When a specific level is crossed in the desired direction, the EMA of that value is calculated for the intended signal line.
When that level is crossed in the opposite direction, the previous "signal" line value is "inherited," becoming a sort of level.
This approach combines signal lines and levels, aiming to integrate the advantages of both methods.
In essence, DSL enhances the signal line concept by inheriting the previous signal line's value and converting it into a level.
Extras
-Alerts
-Signals
Related indicators:
Step RSI

Volume-Weighted RSI with Adaptive SmoothingThis indicator is designed to provide traders with insights into the relative strength of a security by incorporating volume-weighted elements, effectively combining the concepts of Relative Strength Index (RSI) and volume-weighted averages to generate meaningful trading signals.
The indicator calculates the traditional RSI, which measures the speed and change of price movements, as well as the volume-weighted RSI, which considers the influence of trading volume on price action. It then applies adaptive smoothing to the volume-weighted RSI, allowing for customization of the smoothing process. The resulting smoothed volume-weighted RSI is plotted alongside the original RSI, providing traders with a comprehensive view of the price strength dynamics.
The line coloration in this indicator is designed to provide visual cues about the relationship between the RSI and the volume-weighted RSI. When the RSI line is above or equal to the volume-weighted RSI line, it suggests a potentially bullish condition with positive market momentum. In such cases, the line is colored lime. Conversely, when the RSI line (fuchsia) is below the volume-weighted RSI line, it indicates a potentially bearish condition with negative market momentum. The line color is set to fuchsia. By observing the line color, traders can quickly assess the relative strength between the RSI and the volume-weighted RSI, aiding their decision-making process.
The bar color and background color further enhance the visual interpretation of the indicator. The bar color reflects the RSI's relationship with the volume-weighted RSI and the predefined thresholds. If the RSI line is above both the volume-weighted RSI line and the overbought threshold (70), the bar color is set to lime, indicating a potentially overbought condition. Conversely, if the RSI line is below both the volume-weighted RSI line and the oversold threshold (30), the bar color is set to fuchsia, suggesting a potentially oversold condition. When the RSI line is between these two thresholds, the bar color is set to yellow, indicating a neutral or intermediate state. The background color, displayed with a semi-transparent shade, provides additional context by reflecting the prevailing market conditions. It turns lime if the volume-weighted RSI is above the overbought threshold, fuchsia if below the oversold threshold, and yellow if it falls between these two thresholds. This coloration scheme aids traders in quickly assessing market conditions and potential trading opportunities.
Calculations:
-- RSI Calculation : The traditional RSI is calculated based on the price movements of the asset. The up and down movements are determined, and exponential moving averages are used to smooth the values. The RSI value ranges from 0 to 100, with levels above 70 indicating overbought conditions and levels below 30 indicating oversold conditions.
-- Volume-Weighted RSI Calculation : The volume-weighted RSI incorporates the trading volume of the asset into the calculations. The closing price is multiplied by the corresponding volume, and the average is taken over a specific length. The up and down movements are smoothed using exponential moving averages to generate the volume-weighted RSI value.
-- Adaptive Smoothing : The indicator offers an adaptive smoothing option, allowing traders to customize the smoothing process of the volume-weighted RSI. By adjusting the smoothing length, traders can fine-tune the responsiveness of the indicator to changes in market conditions. Smoothing helps reduce noise and enhances the clarity of the signals.
Interpretation:
The indicator provides two main components for interpretation:
-- RSI : The traditional RSI reflects the price momentum and potential overbought or oversold conditions. Traders can look for RSI values above 70 as potential overbought signals, suggesting a possible price reversal or correction. Conversely, RSI values below 30 indicate potential oversold signals, indicating a potential price rebound or rally.
-- Volume-Weighted RSI : The volume-weighted RSI incorporates trading volume, which provides insights into the strength of price movements. When the volume-weighted RSI is above the traditional RSI, it suggests that the buying pressure supported by higher volume is stronger, potentially indicating a more reliable trend. Conversely, when the volume-weighted RSI is below the traditional RSI, it suggests that the selling pressure supported by higher volume is stronger, potentially indicating a more significant price reversal.
Potential Strategies:
-- Overbought and Oversold Signals : Traders can utilize the RSI component of the indicator to identify overbought and oversold conditions. A potential strategy is to consider taking short positions when the RSI is above 70 and long positions when the RSI is below 30. These levels can act as dynamic support and resistance areas, indicating possible price reversals.
-- Confirmation with Volume : Traders can use the volume-weighted RSI as a confirmation tool to validate price movements. When the volume-weighted RSI is above the traditional RSI, it may provide additional confirmation for long positions, suggesting stronger buying pressure. Conversely, when the volume-weighted RSI is below the traditional RSI, it may provide confirmation for short positions, indicating stronger selling pressure.
-- Trend Reversal Strategy : Watch for the volume-weighted RSI to reach extreme levels above 70 (overbought) or below 30 (oversold). Look for a reversal signal where the RSI line (green or fuchsia) crosses below or above the volume-weighted RSI line. Enter a trade when the reversal signal occurs, and the RSI line changes color. Exit the trade when the RSI line crosses back in the opposite direction or reaches the opposite extreme level.
-- Divergence Strategy : Compare the direction of the RSI line (green or fuchsia) with the volume-weighted RSI line. A bullish divergence occurs when the RSI line makes higher lows while the volume-weighted RSI line makes lower lows. A bearish divergence occurs when the RSI line makes lower highs while the volume-weighted RSI line makes higher highs. Once a divergence is identified, wait for the RSI line to cross above or below the volume-weighted RSI line as confirmation of a potential trend reversal. Consider using additional indicators or price action analysis to time the entry more accurately. Use stop-loss orders and profit targets to manage risk and secure profits.
-- Trend Continuation Strategy : Assess the overall trend direction by observing the RSI line's position relative to the volume-weighted RSI line. When the RSI line consistently stays above the volume-weighted RSI line, it indicates a bullish trend, while the opposite suggests a bearish trend. Look for temporary pullbacks within the ongoing trend where the RSI line (green or fuchsia) touches or crosses the volume-weighted RSI line. Enter trades in the direction of the dominant trend when the RSI line crosses back in the trend direction. Exit the trade when the RSI line starts to deviate significantly from the volume-weighted RSI line or when the trend shows signs of weakening through other technical or fundamental factors.
Limitations:
-- False Signals : Like any indicator, the "Volume-Weighted RSI with Adaptive Smoothing" may produce false signals, especially during periods of low liquidity or choppy market conditions. Traders should exercise caution and consider using additional confirmation indicators or tools to validate the signals generated by this indicator.
-- Lagging Nature : The indicator relies on historical price data and volume to calculate the RSI and volume-weighted RSI. As a result, the signals provided may have a certain degree of lag compared to real-time price action. Traders should be aware of this inherent lag and consider combining the indicator with other timely indicators to enhance the accuracy of their trading decisions.
-- Parameter Sensitivity : The indicator's effectiveness can be influenced by the choice of parameters, such as the length of the RSI, smoothing length, and adaptive smoothing option. Different market conditions may require adjustments to these parameters to optimize performance. Traders are encouraged to conduct thorough testing and analysis to determine the most suitable parameter values for their specific trading strategies and preferences.
-- Market Conditions : The indicator's performance may vary depending on the prevailing market conditions. It is essential to understand that no indicator can guarantee accurate predictions or consistently profitable trades. Traders should consider the broader market context, fundamental factors, and other technical indicators to complement the insights provided by the "Volume-Weighted RSI with Adaptive Smoothing" indicator.
-- Subjectivity : Interpretation of the indicator's signals involves subjective judgment. Traders may have varying interpretations of overbought and oversold levels, as well as the significance of the volume-weighted RSI in relation to the traditional RSI. It is crucial to combine the indicator with personal analysis and trading experience to make informed trading decisions.
Remember, no single indicator can provide foolproof trading signals. The "Volume-Weighted RSI with Adaptive Smoothing" indicator serves as a valuable tool for analyzing price strength and volume dynamics. It can assist traders in identifying potential entry and exit points, validating trends, and managing risk. However, it should be used as part of a comprehensive trading strategy that considers multiple factors and indicators to increase the likelihood of successful trades.

Step RSI [Loxx]Enhanced Moving Average Calculation with Stepped Moving Average and the Advantages over Regular RSI
Technical analysis plays a crucial role in understanding and predicting market trends. One popular indicator used by traders and analysts is the Relative Strength Index (RSI). However, an enhanced approach called Stepped Moving Average, in combination with the Slow RSI function, offers several advantages over regular RSI calculations.
Stepped Moving Average and Moving Averages:
The Stepped Moving Average function serves as a crucial component in the calculation of moving averages. Moving averages smooth out price data over a specific period to identify trends and potential trading signals. By employing the Stepped Moving Average function, traders can enhance the accuracy of moving averages and make more informed decisions.
Stepped Moving Average takes two parameters: the current RSI value and a size parameter. It computes the next step in the moving average calculation by determining the upper and lower bounds of the moving average range. It accomplishes this by adjusting the values of smax and smin based on the given RSI and size.
Furthermore, Stepped Moving Average introduces the concept of a trend variable. By comparing the previous trend value with the current RSI and the previous upper and lower bounds, it updates the trend accordingly. This feature enables traders to identify potential shifts in market sentiment and make timely adjustments to their trading strategies.
Advantages over Regular RSI:
Enhanced Range Boundaries:
The inclusion of size parameters in Stepped Moving Average allows for more precise determination of the upper and lower bounds of the moving average range. This feature provides traders with a clearer understanding of the potential price levels that can influence market behavior. Consequently, it aids in setting more effective entry and exit points for trades.
Improved Trend Identification:
The trend variable in Stepped Moving Average helps traders identify changes in market trends more accurately. By considering the previous trend value and comparing it to the current RSI and previous bounds, Stepped Moving Average captures trend reversals with greater precision. This capability empowers traders to respond swiftly to market shifts and potentially capture more profitable trading opportunities.
Smoother Moving Averages:
Stepped Moving Average's ability to adjust the moving average range bounds based on trend changes and size parameters results in smoother moving averages. Regular RSI calculations may produce jagged or erratic results due to abrupt market movements. Stepped Moving Average mitigates this issue by dynamically adapting the range boundaries, thereby providing traders with more reliable and consistent moving average signals.
Complementary Functionality with Slow RSI:
Stepped Moving Average and Slow RSI function in harmony to provide a comprehensive trading analysis toolkit. While Stepped Moving Average refines the moving average calculation process, Slow RSI offers a more accurate representation of market strength. The combination of these two functions facilitates a deeper understanding of market dynamics and assists traders in making better-informed decisions.
Extras
-Alerts
-Signals

Cobra's CryptoMarket VisualizerCobra's Crypto Market Screener is designed to provide a comprehensive overview of the top 40 marketcap cryptocurrencies in a table\heatmap format. This indicator incorporates essential metrics such as Beta, Alpha, Sharpe Ratio, Sortino Ratio, Omega Ratio, Z-Score, and Average Daily Range (ADR). The table utilizes cell coloring resembling a heatmap, allowing for quick visual analysis and comparison of multiple cryptocurrencies.
The indicator also includes a shortened explanation tooltip of each metric when hovering over it's respected cell. I shall elaborate on each here for anyone interested.
Metric Descriptions:
1. Beta: measures the sensitivity of an asset's returns to the overall market returns. It indicates how much the asset's price is likely to move in relation to a benchmark index. A beta of 1 suggests the asset moves in line with the market, while a beta greater than 1 implies the asset is more volatile, and a beta less than 1 suggests lower volatility.
2. Alpha: is a measure of the excess return generated by an investment compared to its expected return, given its risk (as indicated by its beta). It assesses the performance of an investment after adjusting for market risk. Positive alpha indicates outperformance, while negative alpha suggests underperformance.
3. Sharpe Ratio: measures the risk-adjusted return of an investment or portfolio. It evaluates the excess return earned per unit of risk taken. A higher Sharpe ratio indicates better risk-adjusted performance, as it reflects a higher return for each unit of volatility or risk.
4. Sortino Ratio: is a risk-adjusted measure similar to the Sharpe ratio but focuses only on downside risk. It considers the excess return per unit of downside volatility. The Sortino ratio emphasizes the risk associated with below-target returns and is particularly useful for assessing investments with asymmetric risk profiles.
5. Omega Ratio: measures the ratio of the cumulative average positive returns to the cumulative average negative returns. It assesses the reward-to-risk ratio by considering both upside and downside performance. A higher Omega ratio indicates a higher reward relative to the risk taken.
6. Z-Score: is a statistical measure that represents the number of standard deviations a data point is from the mean of a dataset. In finance, the Z-score is commonly used to assess the financial health or risk of a company. It quantifies the distance of a company's financial ratios from the average and provides insight into its relative position.
7. Average Daily Range: ADR represents the average range of price movement of an asset during a trading day. It measures the average difference between the high and low prices over a specific period. Traders use ADR to gauge the potential price range within which an asset might fluctuate during a typical trading session.
Utility:
Comprehensive Overview: The indicator allows for monitoring up to 40 cryptocurrencies simultaneously, providing a consolidated view of essential metrics in a single table.
Efficient Comparison: The heatmap-like coloring of the cells enables easy visual comparison of different cryptocurrencies, helping identify relative strengths and weaknesses.
Risk Assessment: Metrics such as Beta, Alpha, Sharpe Ratio, Sortino Ratio, and Omega Ratio offer insights into the risk associated with each cryptocurrency, aiding risk assessment and portfolio management decisions.
Performance Evaluation: The Alpha, Sharpe Ratio, and Sortino Ratio provide measures of a cryptocurrency's performance adjusted for risk. This helps assess investment performance over time and across different assets.
Market Analysis: By considering the Z-Score and Average Daily Range (ADR), traders can evaluate the financial health and potential price volatility of cryptocurrencies, aiding in trade selection and risk management.
Features:
Reference period optimization, alpha and ADR in particular
Source calculation
Table sizing and positioning options to fit the user's screen size.
Tooltips
Important Notes -
1. The Sharpe, Sortino and Omega ratios cell coloring threshold might be subjective, I did the best I can to gauge the median value of each to provide more accurate coloring sentiment, it may change in the future.
The median values are : Sharpe -1, Sortino - 1.5, Omega - 20.
2. Limitations - Some cryptos have a Z-Score value of NaN due to their short lifetime, I tried to overcome this issue as with the rest of the metrics as best I can. Moreover, it limits the time horizon for replay mode to somewhere around Q3 of 2021 and that's with using the split option of the top half, to remain with the older cryptos.
3. For the beginner Pine enthusiasts, I recommend scimming through the script as it serves as a prime example of using key features, to name a few : Arrays, User Defined Functions, User Defined Types, For loops, Switches and Tables.
4. Beta and Alpha's benchmark instrument is BTC, due to cryptos volatility I saw no reason to use SPY or any other asset for that matter.

Exhaustion Improved Scalping Consolidation and Squeeze IndicatorThis custom indicator, called " Exhaustion & Improved Scalping Consolidation and Squeeze Indicator," is designed to help traders identify potential trading opportunities in the context of price consolidations, squeezes, and momentum exhaustion. It is an overlay indicator that combines several popular technical analysis tools, including the Relative Strength Index (RSI), Moving Average Convergence Divergence (MACD), Bollinger Bands, Keltner Channels, and Rate of Change (ROC). By analyzing these metrics, the indicator aims to provide visual cues on price charts to support better decision-making in the markets.
Use Case for Trading:
Consolidation Detection: The indicator identifies periods of price consolidation, which typically occur when a market is experiencing low volatility and trading in a narrow range. During these periods, the RSI value is between 45 and 55, the MACD histogram is close to zero, and the ROC value is low. The indicator highlights these consolidation periods by coloring the price bars yellow. Traders can use this information to anticipate potential breakouts and prepare for a possible trend initiation.
Squeeze Detection: The indicator detects squeezes by comparing the Bollinger Bands and Keltner Channels. A squeeze occurs when the Bollinger Bands are within the Keltner Channels, indicating that price volatility is decreasing. The indicator colors the price bars orange during a squeeze, which can be a signal for traders to watch for an upcoming increase in volatility and potential trend expansion.
Momentum Exhaustion Detection: The indicator identifies exhaustion in momentum by analyzing the RSI and MACD histogram. When the RSI is above 70, indicating overbought conditions, and the MACD histogram is decreasing, it may signal that the current upward momentum is losing strength. The indicator colors the price bars white in these situations. Traders can use this information to potentially exit long positions or prepare for a trend reversal.

Advanced VWAP_Pullback Strategy_Trend-Template QualifierGeneral Description and Unique Features of this Script
Introducing the Advanced VWAP Momentum-Pullback Strategy (long-only) that offers several unique features:
1. Our script/strategy utilizes Mark Minervini's Trend-Template as a qualifier for identifying stocks and other financial securities in confirmed uptrends. Mark Minervini, a 2x US Investment Champion, developed the Trend-Template, which covers eight different and independent characteristics that can be adjusted and optimized in this trend-following strategy to ensure the best results. The strategy will only trigger buy-signals in case the optimized qualifiers are being met.
2. Our strategy is based on the supply/demand balance in the market, making it timeless and effective across all timeframes. Whether you are day trading using 1- or 5-min charts or swing-trading using daily charts, this strategy can be applied and works very well.
3. We have also integrated technical indicators such as the RSI and the MA / VWAP crossover into this strategy to identify low-risk pullback entries in the context of confirmed uptrends. By doing so, the risk profile of this strategy and drawdowns are being reduced to an absolute minimum.
Minervini’s Trend-Template and the ‘Stage-Analysis’ of the Markets
This strategy is a so-called 'long-only' strategy. This means that we only take long positions, short positions are not considered.
The best market environment for such strategies are periods of stable upward trends in the so-called stage 2 - uptrend.
In stable upward trends, we increase our market exposure and risk.
In sideways markets and downward trends or bear markets, we reduce our exposure very quickly or go 100% to cash and wait for the markets to recover and improve. This allows us to avoid major losses and drawdowns.
This simple rule gives us a significant advantage over most undisciplined traders and amateurs!
'The Trend is your Friend'. This is a very old but true quote.
What's behind it???
• 98% of stocks made their biggest gains in a Phase 2 upward trend.
• If a stock is in a stable uptrend, this is evidence that larger institutions are buying the stock sustainably.
• By focusing on stocks that are in a stable uptrend, the chances of profit are significantly increased.
• In a stable uptrend, investors know exactly what to expect from further price developments. This makes it possible to locate low-risk entry points.
The goal is not to buy at the lowest price – the goal is to buy at the right price!
Each stock goes through the same maturity cycle – it starts at stage 1 and ends at stage 4
Stage 1 – Neglect Phase – Consolidation
Stage 2 – Progressive Phase – Accumulation
Stage 3 – Topping Phase – Distribution
Stage 4 – Downtrend – Capitulation
This strategy focuses on identifying stocks in confirmed stage 2 uptrends. This in itself gives us an advantage over long-term investors and less professional traders.
By focusing on stocks in a stage 2 uptrend, we avoid losses in downtrends (stage 4) or less profitable consolidation phases (stages 1 and 3). We are fully invested and put our money to work for us, and we are fully invested when stocks are in their stage 2 uptrends.
But how can we use technical chart analysis to find stocks that are in a stable stage 2 uptrend?
Mark Minervini has developed the so-called 'trend template' for this purpose. This is an essential part of our JS-TechTrading pullback strategy. For our watchlists, only those individual values that meet the tough requirements of Minervini's trend template are eligible.
The Trend Template
• 200d MA increasing over a period of at least 1 month, better 4-5 months or longer
• 150d MA above 200d MA
• 50d MA above 150d MA and 200d MA
• Course above 50d MA, 150d MA and 200d MA
• Ideally, the 50d MA is increasing over at least 1 month
• Price at least 25% above the 52w low
• Price within 25% of 52w high
• High relative strength according to IBD.
NOTE: In this basic version of the script, the Trend-Template has to be used as a separate indicator on TradingView (Public Trend-Template indicators are available in TradingView – community scripts). It is recommended to only execute buy signals in case the stock or financial security is in a stage 2 uptrend, which means that the criteria of the trend-template are fulfilled.
This strategy can be applied to all timeframes from 5 min to daily.
The VWAP Momentum-Pullback Strategy
For the JS-TechTrading VWAP Momentum-Pullback Strategy, only stocks and other financial instruments that meet the selected criteria of Mark Minervini's trend template are recommended for algorithmic trading with this startegy.
A further prerequisite for generating a buy signals is that the individual value is in a short-term oversold state (RSI).
When the selling pressure is over and the continuation of the uptrend can be confirmed by the MA / VWAP crossover after reaching a price low, a buy signal is issued by this strategy.
Stop-loss limits and profit targets can be set variably. You also have the option to make use of the trailing stop exit strategy.
Relative Strength Index (RSI)
The Relative Strength Index (RSI) is a technical indicator developed by Welles Wilder in 1978. The RSI is used to perform a market value analysis and identify the strength of a trend as well as overbought and oversold conditions. The indicator is calculated on a scale from 0 to 100 and shows how much an asset has risen or fallen relative to its own price in recent periods.
The RSI is calculated as the ratio of average profits to average losses over a certain period of time. A high value of the RSI indicates an overbought situation, while a low value indicates an oversold situation. Typically, a value > 70 is considered an overbought threshold and a value < 30 is considered an oversold threshold. A value above 70 signals that a single value may be overvalued and a decrease in price is likely , while a value below 30 signals that a single value may be undervalued and an increase in price is likely.
For example, let's say you're watching a stock XYZ. After a prolonged falling movement, the RSI value of this stock has fallen to 26. This means that the stock is oversold and that it is time for a potential recovery. Therefore, a trader might decide to buy this stock in the hope that it will rise again soon.
The MA / VWAP Crossover Trading Strategy
This strategy combines two popular technical indicators: the Moving Average (MA) and the Volume Weighted Average Price (VWAP). The MA VWAP crossover strategy is used to identify potential trend reversals and entry/exit points in the market.
The VWAP is calculated by taking the average price of an asset for a given period, weighted by the volume traded at each price level. The MA, on the other hand, is calculated by taking the average price of an asset over a specified number of periods. When the MA crosses above the VWAP, it suggests that buying pressure is increasing, and it may be a good time to enter a long position. When the MA crosses below the VWAP, it suggests that selling pressure is increasing, and it may be a good time to exit a long position or enter a short position.
Traders typically use the MA VWAP crossover strategy in conjunction with other technical indicators and fundamental analysis to make more informed trading decisions. As with any trading strategy, it is important to carefully consider the risks and potential rewards before making any trades.
This strategy is applicable to all timeframes and the relevant parameters for the underlying indicators (RSI and MA/VWAP) can be adjusted and optimized as needed.
Backtesting
Backtesting gives outstanding results on all timeframes and drawdowns can be reduced to a minimum level. In this example, the hourly chart for MCFT has been used.
Settings for backtesting are:
- Period from Jan 2020 until March 2023
- Starting capital 100k USD
- Position size = 25% of equity
- 0.01% commission = USD 2.50.- per Trade
- Slippage = 2 ticks
Other comments
- This strategy has been designed to identify the most promising, highest probability entries and trades for each stock or other financial security.
- The combination of the Trend-Template and the RSI qualifiers results in a highly selective strategy which only considers the most promising swing-trading entries. As a result, you will normally only find a low number of trades for each stock or other financial security per year in case you apply this strategy for the daily charts. Shorter timeframes will result in a higher number of trades / year.
- Consequently, traders need to apply this strategy for a full watchlist rather than just one financial security.

JS-TechTrading: VWAP Momentum_Pullback StrategyGeneral Description and Unique Features of this Script
Introducing the VWAP Momentum-Pullback Strategy (long-only) that offers several unique features:
1. Our script/strategy utilizes Mark Minervini's Trend-Template as a qualifier for identifying stocks and other financial securities in confirmed uptrends.
NOTE: In this basic version of the script, the Trend-Template has to be used as a separate indicator on TradingView (Public Trend-Template indicators are available on TradingView – community scripts). It is recommended to only execute buy signals in case the stock or financial security is in a stage 2 uptrend, which means that the criteria of the trend-template are fulfilled.
2. Our strategy is based on the supply/demand balance in the market, making it timeless and effective across all timeframes. Whether you are day trading using 1- or 5-min charts or swing-trading using daily charts, this strategy can be applied and works very well.
3. We have also integrated technical indicators such as the RSI and the MA / VWAP crossover into this strategy to identify low-risk pullback entries in the context of confirmed uptrends. By doing so, the risk profile of this strategy and drawdowns are being reduced to an absolute minimum.
Minervini’s Trend-Template and the ‘Stage-Analysis’ of the Markets
This strategy is a so-called 'long-only' strategy. This means that we only take long positions, short positions are not considered.
The best market environment for such strategies are periods of stable upward trends in the so-called stage 2 - uptrend.
In stable upward trends, we increase our market exposure and risk.
In sideways markets and downward trends or bear markets, we reduce our exposure very quickly or go 100% to cash and wait for the markets to recover and improve. This allows us to avoid major losses and drawdowns.
This simple rule gives us a significant advantage over most undisciplined traders and amateurs!
'The Trend is your Friend'. This is a very old but true quote.
What's behind it???
• 98% of stocks made their biggest gains in a Phase 2 upward trend.
• If a stock is in a stable uptrend, this is evidence that larger institutions are buying the stock sustainably.
• By focusing on stocks that are in a stable uptrend, the chances of profit are significantly increased.
• In a stable uptrend, investors know exactly what to expect from further price developments. This makes it possible to locate low-risk entry points.
The goal is not to buy at the lowest price – the goal is to buy at the right price!
Each stock goes through the same maturity cycle – it starts at stage 1 and ends at stage 4
Stage 1 – Neglect Phase – Consolidation
Stage 2 – Progressive Phase – Accumulation
Stage 3 – Topping Phase – Distribution
Stage 4 – Downtrend – Capitulation
This strategy focuses on identifying stocks in confirmed stage 2 uptrends. This in itself gives us an advantage over long-term investors and less professional traders.
By focusing on stocks in a stage 2 uptrend, we avoid losses in downtrends (stage 4) or less profitable consolidation phases (stages 1 and 3). We are fully invested and put our money to work for us, and we are fully invested when stocks are in their stage 2 uptrends.
But how can we use technical chart analysis to find stocks that are in a stable stage 2 uptrend?
Mark Minervini has developed the so-called 'trend template' for this purpose. This is an essential part of our JS-TechTrading pullback strategy. For our watchlists, only those individual values that meet the tough requirements of Minervini's trend template are eligible.
The Trend Template
• 200d MA increasing over a period of at least 1 month, better 4-5 months or longer
• 150d MA above 200d MA
• 50d MA above 150d MA and 200d MA
• Course above 50d MA, 150d MA and 200d MA
• Ideally, the 50d MA is increasing over at least 1 month
• Price at least 25% above the 52w low
• Price within 25% of 52w high
• High relative strength according to IBD.
NOTE: In this basic version of the script, the Trend-Template has to be used as a separate indicator on TradingView (Public Trend-Template indicators are available in TradingView – community scripts). It is recommended to only execute buy signals in case the stock or financial security is in a stage 2 uptrend, which means that the criteria of the trend-template are fulfilled.
This strategy can be applied to all timeframes from 5 min to daily.
The VWAP Momentum-Pullback Strateg y
For the JS-TechTrading VWAP Momentum-Pullback Strategy, only stocks and other financial instruments that meet the selected criteria of Mark Minervini's trend template are recommended for algorithmic trading with this startegy.
A further prerequisite for generating a buy signals is that the individual value is in a short-term oversold state (RSI).
When the selling pressure is over and the continuation of the uptrend can be confirmed by the MA / VWAP crossover after reaching a price low, a buy signal is issued by this strategy.
Stop-loss limits and profit targets can be set variably.
Relative Strength Index (RSI)
The Relative Strength Index (RSI) is a technical indicator developed by Welles Wilder in 1978. The RSI is used to perform a market value analysis and identify the strength of a trend as well as overbought and oversold conditions. The indicator is calculated on a scale from 0 to 100 and shows how much an asset has risen or fallen relative to its own price in recent periods.
The RSI is calculated as the ratio of average profits to average losses over a certain period of time. A high value of the RSI indicates an overbought situation, while a low value indicates an oversold situation. Typically, a value > 70 is considered an overbought threshold and a value < 30 is considered an oversold threshold. A value above 70 signals that a single value may be overvalued and a decrease in price is likely , while a value below 30 signals that a single value may be undervalued and an increase in price is likely.
For example, let's say you're watching a stock XYZ. After a prolonged falling movement, the RSI value of this stock has fallen to 26. This means that the stock is oversold and that it is time for a potential recovery. Therefore, a trader might decide to buy this stock in the hope that it will rise again soon.
The MA / VWAP Crossover Trading Strategy
This strategy combines two popular technical indicators: the Moving Average (MA) and the Volume Weighted Average Price (VWAP). The MA VWAP crossover strategy is used to identify potential trend reversals and entry/exit points in the market.
The VWAP is calculated by taking the average price of an asset for a given period, weighted by the volume traded at each price level. The MA, on the other hand, is calculated by taking the average price of an asset over a specified number of periods. When the MA crosses above the VWAP, it suggests that buying pressure is increasing, and it may be a good time to enter a long position. When the MA crosses below the VWAP, it suggests that selling pressure is increasing, and it may be a good time to exit a long position or enter a short position.
Traders typically use the MA VWAP crossover strategy in conjunction with other technical indicators and fundamental analysis to make more informed trading decisions. As with any trading strategy, it is important to carefully consider the risks and potential rewards before making any trades.
This strategy is applicable to all timeframes and the relevant parameters for the underlying indicators (RSI and MA/VWAP) can be adjusted and optimized as needed.
Backtesting
Backtesting gives outstanding results on all timeframes and drawdowns can be reduced to a minimum level. In this example, the hourly chart for MCFT has been used.
Settings for backtesting are:
- Period from April 2020 until April 2021 (1 yr)
- Starting capital 100k USD
- Position size = 25% of equity
- 0.01% commission = USD 2.50.- per Trade
- Slippage = 2 ticks
Other comments
• This strategy has been designed to identify the most promising, highest probability entries and trades for each stock or other financial security.
• The RSI qualifier is highly selective and filters out the most promising swing-trading entries. As a result, you will normally only find a low number of trades for each stock or other financial security per year in case you apply this strategy for the daily charts. Shorter timeframes will result in a higher number of trades / year.
• As a result, traders need to apply this strategy for a full watchlist rather than just one financial security.

Super 6x: RSI, MACD, Stoch, Loxxer, CCI, & Velocity [Loxx]Super 6x: RSI , MACD , Stoch , Loxxer, CCI , & Velocity is a combination of 6 indicators into one histogram. This includes the option to allow repainting.
What is MACD?
Moving average convergence divergence ( MACD ) is a trend-following momentum indicator that shows the relationship between two moving averages of a security’s price. The MACD is calculated by subtracting the 26-period exponential moving average ( EMA ) from the 12-period EMA .
What is CCI?
The Commodity Channel Index ( CCI ) measures the current price level relative to an average price level over a given period of time. CCI is relatively high when prices are far above their average. CCI is relatively low when prices are far below their average. Using this method, CCI can be used to identify overbought and oversold levels.
What is RSI?
The relative strength index is a technical indicator used in the analysis of financial markets. It is intended to chart the current and historical strength or weakness of a stock or market based on the closing prices of a recent trading period. The indicator should not be confused with relative strength .
What is Stochastic?
The stochastic oscillator, also known as stochastic indicator, is a popular trading indicator that is useful for predicting trend reversals. It also focuses on price momentum and can be used to identify overbought and oversold levels in shares, indices, currencies and many other investment assets.
What is Loxxer?
The Loxxer indicator is a technical analysis tool that compares the most recent maximum and minimum prices to the previous period's equivalent price to measure the demand of the underlying asset.
What is Velocity?
In simple words, velocity is the speed at which something moves in a particular direction. For example as the speed of a car travelling north on a highway, or the speed a rocket travels after launching.
How to use
Long signal: All 4 indicators turn green
Short signal: All 4 indicators turn red
Included
Bar coloring
Alerts

AntaresLibrary "Antares"
this library contains some utility functions that I use in my open source scripts including moving average helpers, candlstick helpers, money management, formatters, convertors, webhook integration, analysis, filters and drawing helpers
ma(type, length, source)
Wraps all ma functions
Parameters:
type : Either SMA or EMA or RMA or WMA or VWMA
length : Number of bars (length).
source : Series of values to process.
Returns: Moving average of `source` for `length` bars back by the of MA.
bb(ma, length, mult, source)
Overwrites `ta.bb` duo to limitations of simple int.float mult. Bollinger Bands. A Bollinger Band is a technical analysis tool defined by a set of lines plotted two standard deviations (positively and negatively) away from a simple moving average (SMA) of the security's price, but can be adjusted to user preferences.
Parameters:
ma : Either SMA or EMA or RMA or WMA or VWMA
length : Number of bars (length).
mult : Standard deviation factor.
source : Series of values to process.
Returns: Bollinger Bands.
atr(length, h, l, c)
Overwrites `ta.atr` duo to limitations of simple int length. Function atr (average true range) returns the RMA of true range. True range is max(high - low, abs(high - close ), abs(low - close )).
Parameters:
length : Number of bars (length).
h : High price high price.
l : low price.
c : Close price close price.
Returns: Average true range.
rsi(length, source)
Overwrites `ta.rsi` duo to limitations of simple int length. Relative strength index. It is calculated using the `ta.rma()` of upward and downward changes of `source` over the last `length` bars.
Parameters:
length : Number of bars (length).
source : Series of values to process.
Returns: Relative strength index.
lowest(length, source, start)
Lowest value for a given number of bars back.
Parameters:
length : Number of bars (length).
source : Series of values to process.
start : Series number of bars that should be skipped before process.
Returns: Lowest value in the series.
highest(length, source, start)
Highest value for a given number of bars back.
Parameters:
length : Number of bars (length).
source : Series of values to process.
start : Series number of bars that should be skipped before process.
Returns: Highest value in the series.
atr_multiplier(rsi, atr_max_multiplier)
Dynamic atr multiplier calculated by RSI.
Parameters:
rsi : Relative strength index.
atr_max_multiplier : The maximum multiplier of atr
Returns: Dynamic multiplier of ATR
offset(atr, atr_multiplier)
Safe dynamic offset you need to use in your stoploss, stop buy/sell, etc.
Parameters:
atr : Average true range.
atr_multiplier : ATR multiplier got from `atr_multiplier(rsi, atr_max_multiplier)`
Returns: Dynamic offset
rsi_emotional(rsi, bottom, top)
Tells you if RSI is in emotional zone.
Parameters:
rsi : Relative Strength Index
bottom : The zone that below it market reacts emotionally
top : The zone that above it market reacts emotionally
Returns: false if RSI was between `bottom` and `top` otherwise true
rsi_signal(rsi, bottom, top)
Tells you if RSI is in good point to check your other strategy conditions.
Parameters:
rsi : Relative Strength Index
bottom : The zone that below it market reacts emotionally
top : The zone that above it market reacts emotionally
Returns: 1 if RSI crossed out 30, 50 or 70. -1 if RSI crossed under 70, 50, 30. otherwise is 0
Global & local RSI / quantifytoolsAs the terms global and local imply, global RSI describes broad relative strength, whereas local RSI describes local relative strength within the broad moves. A macro and micro view of relative strength so to speak. Global and local RSI are simply regular RSI and stochastic RSI. Local RSI extremes ( stochastic RSI oversold/overbought) often mark a pivot in RSI which naturally reflects to price. Local RSI extremes are visualized inside the global RSI bands (upper band for overbought, lower band for oversold) in a "heat map" style.
By default:
Stochastic RSI >= 75 = yellow
Stochastic RSI >= 87 = orange
Stochastic RSI >= 100 = pink
Users also have the ability smooth the RSI with their preferred smoothing method ( SMA , EMA , HMA , RMA, WMA ) and length. This leads to different behavior in RSI, rendering the typical RSI extremes (> 70 or < 30) suboptimal or even useless. By enabling adaptive bands, the extremes are readjusted based on typical RSI pivot points (median pivots ), which gives much more relevant reference points for oversold/overbought conditions in both global and local RSI. This feature can be used without smoothing, but it rarely provides a meaningful difference, unless the RSI calculation length is messed with.
Global RSI can be plotted as candles, bars or a line. Candles and bars can be useful for detecting rejections (wicks) in relative strength, the same you would with OHLC data. Sometimes there are "hidden rejections" that are visible in relative strength but not on OHLC data, which naturally gives an advantage. All colors can be adjusted in the input menu. You also have a real-time view of the current RSI states in top right corner. Available alerts are the following: global RSI overbought, global RSI oversold, local RSI overbought and local RSI oversold.

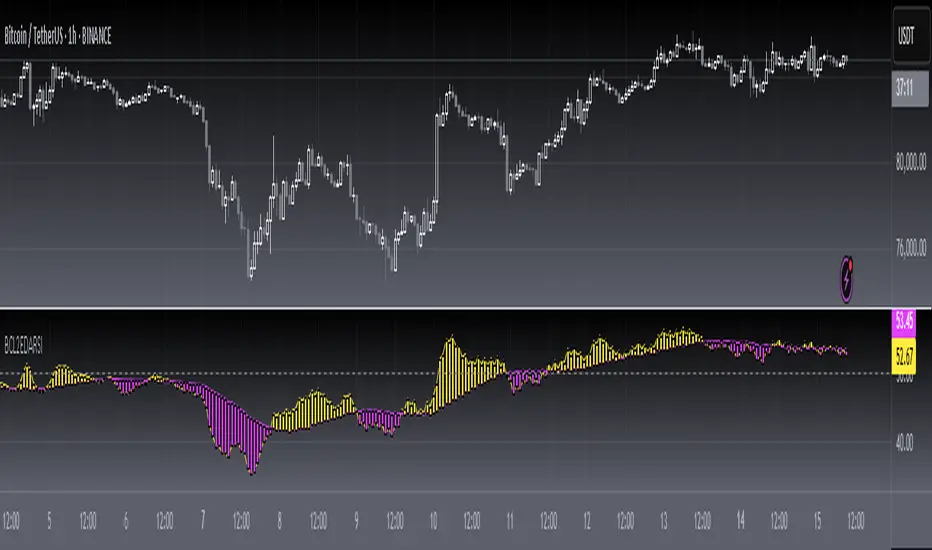
Relative Bi-Directional Volatility RangeThe basic math behind this Indicator is very similar to the math behind the Relative Strength Index without using a standard deviation as used for the Relative Volatility Index. The Volatility Range is calculated by utilizing the highs and lows. However not in the same way as in the Relative Volatility Index. This approach leads to different values, but the overall result clearly reveals the intrinsic Volatility of the chart, so the user can be aware, when something fundamentally is going on behind the scenes. If the Volatility rises on positive and negative range (-100 to 100) it implies that something fundamental is changing.
An advantage of using this kind of calculation is the possibility of separating the data into positive (buy pressure) and negative (sell pressure) components. The bi-directional character shows a slightly overhang in one of the directions, which can be used to detect a trend. A Moving Average of the users choice shell smoothen the overhang of the Relative Bi-Directional Volatility and show a trend direction. Similar to the math of the Relative Strength Index as standard a Relative Moving Average is preferred. If the Moving Average is in the positive range (0 to 100) it indicates a bullish trend, else if the Moving Average is in the negative range (0 to -100) it indicates a bearish trend. External Indicators can use a provided Trend Shift Signal which switches from 0 to 1, if the trend becomes bullish or from 0 to -1, if the trend becomes bearish.
The user should know, that in this Indicator the starting point of the Moving Averages always begins at the first bar, because the starting progress is approximated appropriately. Most Moving Averages require a minimum number of bars to be calculated, which is chosen with the Moving Average Length. In this cases the length used will be automatically reduced in the background until the number of bars is sufficient to match the chosen length. So if data history is very short, the Indicator can be used never the less as good as possible.
It is feasible to switch the Indicator on a higher timeframe, while staying in a lower timeframe on the chart. This can be useful for making the indication cleaner, if the Moving Average is to choppy and shows too many false signals. On the other hand the benefit of a higher timeframe (or a higher Moving Average Length) is paid with higher latency of the signaling. So the user has to decide what the best setting in his case is.
This Indicator can be used with all kinds of charts. Even charts with percentage or negative values should work fine.

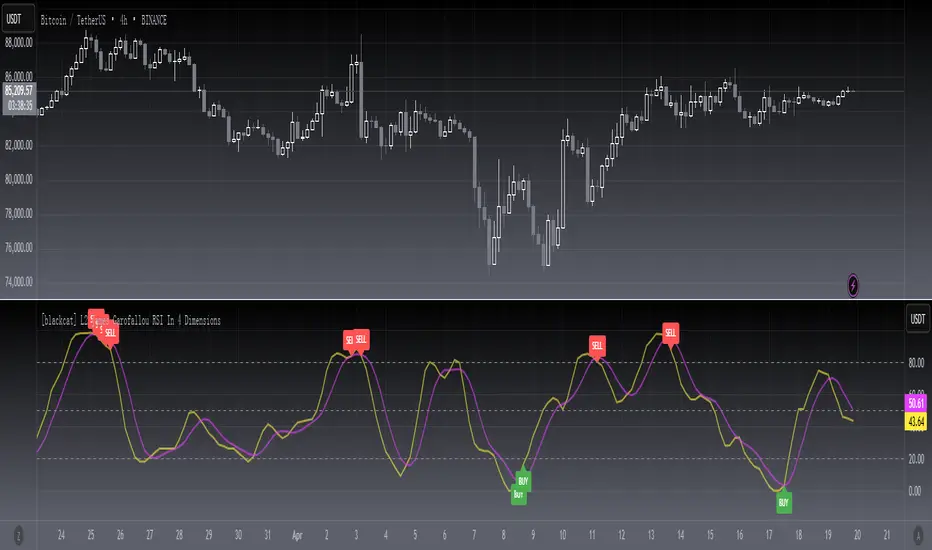
[blackcat] L2 James Garofallou RSI In 4 DimLevel 2
Background
Traders’ Tips of September 2020, the focus is James Garofallou’s article in the September issue, “Tracking Relative Strength In Four Dimensions”.
Function
In “Tracking Relative Strength In Four Dimensions” in this issue, author James Garofallou introduces us to a new method of measuring the relative strength of a security. This new technique creates a much broader reference than would be obtained by using a single security or index and combines several dimensions, as the author calls them, into a single rank value. This study compares a security to another in four dimensions, as explained in the article. James Garofallou presents a metric for a security’s strength relative to 11 major market sectors and over several time periods. All this is squeezed into a single value. The first step is the RS2. It normalizes the security to a market index, then calculates four moving averages and encodes their relations in a returned number. I just modified it by using most BTC-correlated instruments to reflect how BTC response to their performance.
Remarks
This is a Level 2 free and open source indicator.
Feedbacks are appreciated.
[blackcat] L1 Vitali Apirine RS EMALevel 1
Background
For Traders’ Tips for 2022.05, the focus is Vitali Apirine’s article in the January 2022 issue, “Relative Strength Moving Averages, Part 1: The Relative Strength Exponential Moving Average (RS EMA)”.
Function
Author Vitali Apirine introduces the relative strength exponential moving average (RS EMA). The study is designed to account for relative strength of price and is considered a trend-following indicator that can be used in combination with an EMA of the same length to identify the overall trend. RS EMAs with different lengths can define turning points and filter price movements.
Remarks
This is a Level 1 free and open source indicator.
Feedbacks are appreciated.

Alpha Relative Strength IndexA bullish signal on the RSI indicator signals that price did not move in sync with the RSI; price moved low, but the RSI moved less. This bullish divergence is an indication of strengthening momentum. A bearish signal on the RSI indicator signals that price and RSI are not in sync

Average Directional Index + ΔDI± (Delta)Average Directional Index (ADX) and Difference between DI+ and DI- (ΔDI±), I call it Delta for short.
The idea explained:
ADX is a common indicator for analysing trend strength. Values over 25 usually indicate the symbol is in "trend mode", meaning there is a lot of momentum, upwards or downwards, - while values under 25 suggest it is in "range mode", the price moves sideways, lacking energy. Note that this indicator is not volume-based.
I moved the graph (red) down 25 points; this version shows positive values in "trend mode" (>25), and negative values in "range mode" (<25). The line sits at 0. The underlying code for the ADX is basically identical to the official TradingView built-in version.
Now the exciting part: DI+ and DI- are used to calculate the ADX. They are sometimes included in the ADX indicator chart, I included a version that shows them in the graphic, at the bottom. Traditionally, DI+ (green) crossing DI- (dark red) from below shows the beginning of an upward trend, and therefore a good LONG entry position. However, I noticed that this is usually not the case: this method responds very slowly to the actual price movement. At the point the indicator tells you to enter, the trend is usually already exhausted.
I found a better way to use this data; instead of waiting for both graphs to cross, meaning the difference in their respective values is 0, we look for the greatest possible difference. That is what the purple graph of my indicator shows (ΔDI±). It utilizes the zero-line we already created for the ADX. High positive values declare that the DI+ is much greater than the DI-, and vice versa. Delta is the greek letter used in mathematics for difference, so that is what I call this indicator.
How to use it:
When you look at the graph, low Delta values seem to be good entry points for LONG positions, high Delta values good exits. This is similar to how RSI and CCI work, which is why included them in the chart above (). However, this is only reliable, when the ADX is above 25, or 0 in this version, indicating the symbol is in "trend mode". This is important .
When you look at the examples in the chart, you can confirm that. The marked candles show good entry and exit points, with Delta being notably low/high (±25 seems to be a good threshold, the dashed lines sit at +30/-30), and the ADX above 0 (25). Now, you might have noticed that around mid-december the Delta actually registers the highest value for this symbol in the given time frame, indicating a strong SHORT after a steep climb. But, importantly , the ADX is not in "trend mode" as required for a clear signal, it is in "range mode": the price discovers this new level and takes a few days to get used to it. It does not fall. This shows why only the combination of both Delta and ADX gives desirable results.
I noticed that this seems to work best for 1D and 1H candles; if you find any other time frames or scenarios, let me know!
PLEASE NOTE THAT THIS IS BASED ON PERSONAL, EMPIRICAL OBSERVATIONS. PAST RESULTS DO NOT GUARANTEE SUCCESS IN THE FUTURE. DO NOT TAKE THIS AS INVESTMENT ADVICE!
Thanks to TradingView and robertkowalski for providing the basis on which the code is built. Credit goes to the appropriate developers/owners.
()
Let me know if you make any other observations, or find other ways to use the data!

Cyclic Smoothed RSI with Motive-Corrective Wave Indicator
This indicator uses the cyclic smoothed Relative Strength Index (cRSI) instead of the traditional Relative Strength Index (RSI). See below for more info on the benefits to the cRSI.
My key contributions
1) A Weighted Moving Average (WMA) to track the general trend of the cRSI signal. This is very helpful in determining when the equity switches from bullish to bearish, which can be used to determine buy/sell points. This is then is used to color the region between the upper and lower cRSI bands (green above, red below).
2) An attempt to detect the motive (impulse) and corrective and waves. Corrective waves are indicated A, B, C, D, E, F, G. F and G waves are not technically Elliot Waves, but the way I detect waves it is really hard to always get it right. Once and a while you could actually see G and F a second time. Motive waves are identified as s (strong) and w (weak). Strong waves have a peak above the cRSI upper band and weak waves have a peak below the upper band.
3) My own divergence indicator for bull, hidden bull, bear, and hidden bear. I was not able to replicate the TradingView style of drawing a line from peak to peak, but for this indicator I think in the end it makes the chart cleaner.
There is a latency issue with an indicator that is based on moving averages. That means they tend to trigger right after key events. Perfect timing is not possible strictly with these indicators, but they do work very well "on average." However, my implementation has minimal latency as peaks (tops/bottoms) only require one bar to detect.
As a bit of an Easter Egg, this code can be tweaked and run as a strategy to get buy/sell signals. I use this code for both my indicator and for trading strategy. Just copy and past it into a new strategy script and just change it from study to a strategy, something like this:
strategy("cRSI + Waves Strategy with VWMA overlay", overlay=overlay)
The buy/sell code is at the end and just needs to be uncommented. I make no promises or guarantees about how good it is as a strategy, but it gives you some code and ideas to work with.
Tuning
1) Volume Weighted Moving Average (VWMA): This is a “hidden strategy” feature implemented that will display the high-low bands of the VWMA on the price chart if run the code using “overlay = true”.
- If the equity does not have volume, then the VWMA will not show up. Uncheck this box and it will use the regular WMA (no volume).
- defines how far back the WMA averages price.
2) cRSI (Black line in the indicator)
- Increase to length that amount of time a band (upper/lower) stays high/low after a peak. Reduce the value to shorten the time. Just increment it up/down to see the effect.
- defines how far back the SMA averages the cRSI. This affects the purple line in the indicator.
- defines how many bars back the peak detector looks to determine if a peak has occurred. For example, a top is detected like this: current-bar down relative to the 1-bar-back, 1-bar-back up relative to 2-bars-back (look back = 1), c) 2-bars-back up relative to 3-bars-back (lookback = 2), and d) 3-bars-back up relative to 4-bars-back (lookback = 3). I hope that makes sense. There are only 2 options for this setting: 2 or 3 bars. 2 bars will be able to detect small peaks but create more “false” peaks that may not be meaningful. 3 bars will be more robust but can miss short duration peaks.
3) Waves
- The check boxes are self explanatory for which labels they turn on and off on the plot.
4) Divergence Indicators
- The check boxes are self explanatory for which labels they turn on and off on the plot.
Hints
- The most common parameter to change is the . Different stocks will have different levels of strength in their peaks. A setting of 2 may generate too many corrective waves.
- Different times scales will give you different wave counts. This is to be expected. A counter impulse wave inside a corrective wave may actually go above the cRSI WMA on a smaller time frame. You may need to increase it one or two levels to see large waves.
- Just because you see divergence (bear or hidden bear) does not mean a price is going to go down. Often price continues to rise through bears, so take note and that is normal. Bulls are usually pretty good indicators especially if you see them on C,E,G waves.
----------------------------------------------------------------------------------------------------------------------------
cyclic smoothed RSI (cRSI) indicator
----------------------------------------------------------------------------------------------------------------------------
The “core” code for the cyclic smoothed RSI (cRSI) indicator was written by Lars von Theinen and is subject to the terms of the Mozilla Public License 2.0 at mozilla.org Copyright (C) 2017 CC BY, whentotrade / Lars von Thienen. For more details on the cRSI Indicator:
The cyclic smoothed RSI indicator is an enhancement of the classic RSI, adding
1) additional smoothing according to the market vibration,
2) adaptive upper and lower bands according to the cyclic memory and
3) using the current dominant cycle length as input for the indicator.
It is much more responsive to market moves than the basic RSI. The indicator uses the dominant cycle as input to optimize signal, smoothing, and cyclic memory. To get more in-depth information on the cyclic-smoothed RSI indicator, please read Decoding The Hidden Market Rhythm - Part 1: Dynamic Cycles (2017), Chapter 4: "Fine-tuning technical indicators." You need to derive the dominant cycle as input parameter for the cycle length as described in chapter 4.
Hope this helps and good luck.

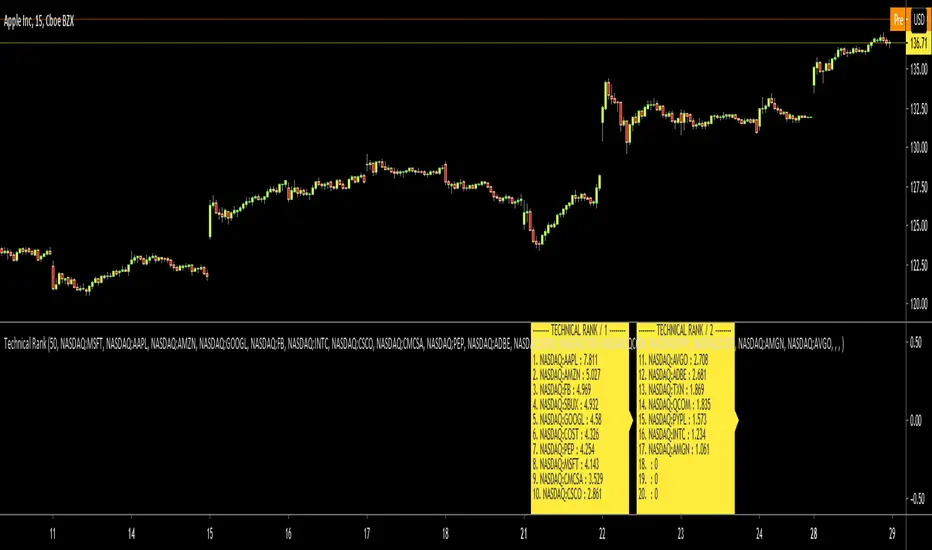
Technical RankHello Traders,
Technical Rank (TR) was authored by John Murphy . Technical Rank shows how a security is performing relative to its peers. Multiple moving averages, rate of change and the Relative Strength Index (RSI) indicators are used to calculate the Technical Rank. These values are mathematically manipulated with percentage factors and then summed together. there are 3 parts, long term, middle term and short term. for Long term part Moving Average with length 200 (30%) and Rate of Change with the length 125 (30%) are used, for middle term part, Moving Average with length 50 (15%) and Rate of Change with the length 20 (15%) are used and for short term part, PPO (5%) and RSI (5%) used.
Technical Rank is created using the following formula and weightings:
Long-Term Indicators (weighting): Percent above/below the 200-day exponential moving average (EMA) (30% weight) and the 125-day rate-of-change (ROC) (30% weight).
Medium-Term Indicators (weighting): Percent above/below 50-day EMA (15%) and the 20-day rate-of-change (15%).
Short-Term Indicators (weighting): Three-day slope of percentage price oscillator histogram divided by three (5%) and the relative strength index (5%).
The scripts calculates Technical Rank for 10 different securities and sorts them by Technical Rank value. A ranking of zero indicates the stock is the weakest in the group technically. A rank of 100 indicates the stock ranks highest in terms of technical performance. An increasing Technical Rank means the stock's price performance is showing strength relative to the group of stock being analyzed. A decreasing Technical Rank shows deteriorating relative price performance. Securities in the top 3-4 will have a technical rank of 70 or higher. You should focus on these relatively strong securities for potential long positions on pullbacks. You can also use the technical rank to avoid weak securities (in the bottom 3-4). I recommend you to check Technical Rank for the securities in multiple time frames.
You can choose the symbols as you want but you should choose the symbols with the same session info. for example only Cryptos, only Stocks, only FX pairs etc. (not mix of them).
Enjoy!
[blackcat] L2 Ehlers DFT-Adapted RSILevel: 2
Background
John F. Ehlers introuced his DFT-ADAPTED RELATIVE STRENGTH INDEX (RSI) in Jan, 2007.
Function
In "Fourier Transform For Traders" in Jan, 2007, John Ehlers presented an interesting technique of improving the resolution of spectral analysis that could be used to effectively measure market cycles. Better resolution is obtained by a surprisingly simple modification of the discrete Fourier transform. John Ehlers suggests using the discrete Fourier transform (DFT) to tune indicators. Here, I demonstrate this by building a DFT-adapted relative strength index (RSI) strategy.
Rather than display the RSI for a single cycle length across the entire chart, Ehlers DFT adaptive RSI value reflects the DFT-calculated dominant cycle length RSI. If the dominant cycle changes from 14 to 18 bars, the RSI length parameter changes accordingly. Computationally, this requires the strategy to continuously update values for all possible RSI cycle lengths via a "for" loop and array.
In details, a full-featured formula that implements a high-pass filter (HP) and a six-tap low-pass finite impulse response (FIR) filter on input, then does discrete Fourier transform calculations. I has taken liberty of adding extra parameters so the user can modify the analysis window length and the high-pass filter cutoff frequency in real time using the parameters window. Once the suite of possible RSI values is calculated, we use the DFT to select the relevant RSI for the current bar. The strategy then trades according to J. Welles Wilder's original rules for the RSI.
Key Signal
fastline--> DFT-ADAPTED RELATIVE STRENGTH INDEX (RSI) fast line
slowline--> DFT-ADAPTED RELATIVE STRENGTH INDEX (RSI) slow line
Pros and Cons
100% John F. Ehlers definition translation, even variable names are the same. This help readers who would like to use pine to read his book.
Remarks
The 71th script for Blackcat1402 John F. Ehlers Week publication.
Based on original work of Ehlers, I added ALMA smoothing on DFT-adapted relative strength index (RSI) so that clearer trend can be observed.
Readme
In real life, I am a prolific inventor. I have successfully applied for more than 60 international and regional patents in the past 12 years. But in the past two years or so, I have tried to transfer my creativity to the development of trading strategies. Tradingview is the ideal platform for me. I am selecting and contributing some of the hundreds of scripts to publish in Tradingview community. Welcome everyone to interact with me to discuss these interesting pine scripts.
The scripts posted are categorized into 5 levels according to my efforts or manhours put into these works.
Level 1 : interesting script snippets or distinctive improvement from classic indicators or strategy. Level 1 scripts can usually appear in more complex indicators as a function module or element.
Level 2 : composite indicator/strategy. By selecting or combining several independent or dependent functions or sub indicators in proper way, the composite script exhibits a resonance phenomenon which can filter out noise or fake trading signal to enhance trading confidence level.
Level 3 : comprehensive indicator/strategy. They are simple trading systems based on my strategies. They are commonly containing several or all of entry signal, close signal, stop loss, take profit, re-entry, risk management, and position sizing techniques. Even some interesting fundamental and mass psychological aspects are incorporated.
Level 4 : script snippets or functions that do not disclose source code. Interesting element that can reveal market laws and work as raw material for indicators and strategies. If you find Level 1~2 scripts are helpful, Level 4 is a private version that took me far more efforts to develop.
Level 5 : indicator/strategy that do not disclose source code. private version of Level 3 script with my accumulated script processing skills or a large number of custom functions. I had a private function library built in past two years. Level 5 scripts use many of them to achieve private trading strategy.
Currency Group Stochastic (Dual Timeframe)
This is a stochastic for an entire currency group (majors and crosses). So if you are wondering whether the entire group will reverse this might help. For example, if you are think the USD group will roll over you can see an amalgamated stochastic of AUDUSD, NZDUSD, USDJPY, USDCHF, EURUSD, GBPUSD, USDCAD (average stochastic of all of them). The concept is that it might give help to identify 2 opposing currencies - an overbought currency verses an oversold currency.
Also, if your 'classic' instrument specific stochastic is showing an entry, does the the entire currency group agree?
There's more! You can also see the stochastic of the timeframe above on the current timeframe. You're current period stochastic tells you you've an entry and the stochastic from the timeframe above can indicate there is momentum in your direction. (There is a classic stochastic version of this on my profile)
There is a limit to how much I can fit into a single indicator so if you want to see the current and timeframe above together (recommended) you need to overlap the indicator on itself. See below
You can create a dashboard combined with 'currency relative strengths' (that indicator is on my profile) as per below. You now have an idea of the currency strengths, which currencies are correlating and potential turning point to help you decide which currencies to focus on...
Example...
gbp group COULD be ready to buy
chf group COULD be ready to sell
gbpchf - wait for the 3 min chart to roll over and an its not a bad call (considering it took 60 secs to review the market and choose an entry with the possible backing of the entire currency groups :o) )
REMEMBER, YOU CAN'T THIS TRADE FROM THIS INDICATOR. LOOK AT IT TO UNDERSTAND WHAT THE MARKET MIGHT BE DOING AND FOCUS YOUR DETAILED ATTENTION BASED ON YOUR CONCLUSION.
Good luck

Neglected Volume by DGTVolume is one piece of information that is often neglected, however, learning to interpret volume brings many advantages and could be of tremendous help when it comes to analyzing the markets. In addition to technicians, fundamental investors also take notice of the numbers of shares traded for a given security.
What is Volume?
The volume represents all the recorded trades for a security that occurs in a given time interval. It is a measurement of the participation, enthusiasm, and interest in a given security. Think of volume as the force that drives the market. Volume substantiates, energizes, and empowers price. When volume increases, it confirms price direction; when volume decreases, it contradicts price direction.
In theory, increases in volume generally precede significant price movements. However, If the price is rising in an uptrend but the volume is reducing or unchanged, it may show that there’s little interest in the security, and the price may reverse.
A high volume usually indicates more interest in the security and the presence of institutional traders. However, a rapidly rising price in an uptrend accompanied by a huge volume may be a sign of exhaustion.
Traders usually look for breaks of support and resistance to enter positions. When security break critical levels without volume, you should consider the breakout suspect and prime for a reversal off the highs/lows
Volume spikes are often the result of news-driven events. Volume spike will often lead to sharp reversals since the moves are unsustainable due to the imbalance of supply and demand
note : there’s no centralized exchange where trades are recorded, so the volume data represents what happens at a particular exchange only
In most charting platforms, the volume indicator is presented as color-coded bars, green if the security closes up and red if the security closed lower, where the height of the bars show the amount of the recorded trades
Within this study, Relative Volume , Volume Weighted Bars and Volume Moving Average are presented, where Relative Volume relates current trading volume to past trading volume over long period, Volume Weighted Bars presents price bars colored based on short period past trading volume average, and Volume Moving Average is average of volume over shot period
Relative Volume is presented as color-coded bars similar to regular Volume indicator but uses four color codes instead two. Notable increases of volume are presented in green and red while average values with back and gray, hence adding ability to emphasis notable increases in the volume. It is kind of a like a radar for how "in-play" a security is. Users are allowed to change the threshold, default value is set to Fibonacci golden ration standard deviation away from its moving average.
Volume Weighted Bars, a study of Kıvanç Özbilgiç, aims to present if price movements are supported by Volume. Volume Weighted Bars are calculated based on shot period volume moving average which will reflect more recent changes in volume. Price actions with high volume will be displayed with darker colors, average volume values will remain as they are and low volume values will be indicated with lighter colors.
Volume Moving Average, Is short period volume moving average, aims to display visually the volume changes. Please not that Relative Volume bars are calculated based on standard deviation of long volume moving average.
What Else?
Apart from the volume itself, your ability to assess what volume is telling you in conjunction with price action can be a key factor in your ability to turn a profit in the market. It makes little sense to analyze the volume alone. To correctly interpret the volume data, it shall be seen in the light of what the price is doing. there are a lot of other indicators that are based on the volume data as well as price action. Analysing those volume indicators has always helped traders and investors to better understand what is happening in the market.
Here are the ones adapted with this study. Some of them used as a source for our aim, some adapted as they are with slight changes to fit visually to this study and please note that the numerical presentation may differ from their regular use
• On Balance Volume
• Divergence Indicator
• Correlation Coefficient
• Chaikin Money Flow
Shortly;
On Balance Volume
The On Balance Volume indicator, is a technical analysis indicator that relates volume flow to changes in a security’s price. It uses a cumulative total of positive and negative trading volume to predict the direction of price. The OBV is a volume-based momentum oscillator, so it is a leading indicator — it changes direction before the price
Granville, creator of OBV, proposed the theory that changes in volume precede price movements in a measurable way. He believed that volume was the main force behind major market moves and thought of OBV’s prediction of price changes as a compressed spring that expands rapidly when released.
It is believed that the OBV shows the interactions between the institutional and retail traders in the market
If the price makes a new high, the OBV should also make a new high. If the OBV makes a lower high when the price makes a higher high, there’s a classical bearish divergence — indicating that only the retail traders are buying. Another type of bearish divergence occurs when the price remains relatively quiet and fails to make a higher high but the OBV soars higher than the previous high — indicating that the institutional traders are accumulating short positions. On the other hand, if the price makes a lower low and the OBV makes a higher low, there is a classical bullish divergence, showing that the institutional traders don’t believe in that move
With this study, Momentum and Acceleration (optional) of OBV is calculated and presented, where momentum is most commonly referred to as a rate and measures the acceleration of the price and/or volume of a security. It is also referred to as a technical analysis indicator and oscillator that is able to determine market trends.
Additionally, smoothing functionality with Least Squares Method is added
Divergences especially, should always be noted as a possible reversal in the current trend, so the divergence indicator is adapted with this study where the Momentum of OBV is assumed as Oscillator with similar usages as to RSI. Divergence is most often used to track and analyze the momentum in an asset’s price and the odds of a price reversal within the current trend. The divergence indicator warns traders and technical analysts of changes in a price/volume trend, oftentimes that it is weakening or changing direction.
Correlation Coefficient
The correlation coefficient is a statistical measure of the strength of the relationship between the relative movements of two variables. A correlation of -1.0 shows a perfect negative correlation, while a correlation of 1.0 shows a perfect positive correlation. A correlation of 0.0 shows no linear relationship between the movement of the two variables. In other words, the closer the Correlation Coefficient is to 1.0, indicates the instruments will move up and down together as it is mostly expected with volume and price. So the Correlation Coefficient Indicator aims to display when the price and volume (on balance volume) is in correlation and when not. With this study blue represent positive correlation while orange negative correlation. The strength of the correlation is determined by the width of the bands, to emphasis the effect horizontal lines are drawn with values set to 0.5 and -0.5. the values above 0.5 (or below -0.5) shows stronger correlation.
Chaikin Money Flow , provide optionally as a companion indicator
The Chaikin money flow indicator (CMF) is a volume indicator that measures the money flow volume over a chosen period. The money flow volume is a measure of the volume and where the price closed relative to the trading session’s range. It comes from the idea that buying pressure is indicated by a rising volume and recurrent closes in the upper part of the session’s price range while selling pressure is demonstrated by an increasing volume and repeated closes in the lower part of the price range.
Both buying and selling pressures are accompanied by an increase in volume, but the location of the closing prices are in accordance with the direction of price
Special thanks to @InvestCHK and @hjsjshs , who have enormously contributed while preparing this study
related studies:
Disclaimer:
Trading success is all about following your trading strategy and the indicators should fit within your trading strategy, and not to be traded upon solely
The script is for informational and educational purposes only. Use of the script does not constitute professional and/or financial advice. You alone have the sole responsibility of evaluating the script output and risks associated with the use of the script. In exchange for using the script, you agree not to hold dgtrd TradingView user liable for any possible claim for damages arising from any decision you make based on use of the script

Market Regime | NY Session Killzones Indicator [ApexLegion]Market Regime | NY Session Killzones Indicator
Introduction and Theoretical Background
The Market Regime | NY Session Killzones indicator is designed exclusively for New York market hours (07:00-16:00 ET). Unlike universal indicators that attempt to function across disparate global sessions, this tool employs session-specific calibration to target the distinct liquidity characteristics of the NY trading day: Pre-Market structural formation (08:00-09:30), the Morning breakout window (09:30-12:00), and the Afternoon Killzone (13:30-16:00)—periods when institutional order flow exhibits the highest concentration and most definable technical structure. By restricting its operational scope to these statistically significant time windows, the indicator focuses on signal relevance while filtering the noise inherent in lower-liquidity overnight or extended-hours trading environments.
I. TECHNICAL RATIONALE: THE PRINCIPLE OF CONTEXTUAL FUSION
1. The Limitation of Acontextual Indicators
Traditional technical indicators often fail because they treat every bar and every market session equally, applying static thresholds (e.g., RSI > 70) without regard for the underlying market structure or liquidity environment. However, institutional volume and market volatility are highly dependent on the time of day (session) and the prevailing long-term risk environment.
This indicator was developed to address this "contextual deficit" by fusing three distinct yet interdependent analytical layers:
• Time and Structure (Macro): Identifying high-probability trading windows (Killzones) and critical structural levels (Pre-Market Range, PDH/PDL).
• Volatility and Scoring (Engine): Normalizing intraday momentum against annual volatility data to create an objective, statistically grounded AI Score.
• Risk Management (Execution): Implementing dynamic, volatility-adjusted Stop Loss (SL) and Take Profit (TP) parameters based on the Average True Range (ATR).
2. The Mandate for 252-Day Normalization (Z-Score)
What makes this tool unique is its 252-day Z-Score normalization engine that transforms raw momentum readings into statistically grounded probability scores, allowing the same indicator to deliver consistent, context-aware signals across any timeframe—from 1-minute scalping to 1-hour swing trades—without manual recalibration.
THE PROBLEM OF SCALE INVARIANCE
A high Relative Strength Index (RSI) reading on a 1-minute chart has a completely different market implication than a high RSI reading on a Daily chart. Simple percentage-based thresholds (like 70 or 30) do not provide true contextual significance. A sudden spike in momentum may look extreme on a 5-minute chart, but if it is statistically insignificant compared to the overall volatility of the last year, it may be a poor signal.
THE SOLUTION: CROSS-TIMEFRAME Z-SCORE NORMALIZATION
This indicator utilizes the Pine Script function request.security to reference the Daily timeframe for calculating the mean (μ) and standard deviation (σ) of a momentum oscillator (RSI) over the past 252 trading days (one year).
The indicator then calculates the Z-Score (Z) for the current bar's raw momentum (x): Z = (x - μ) / σ
Core Implementation: float raw_rsi = ta.rsi(close, 14) // x
= request.security(syminfo.tickerid, "D",
, // σ (252 days)
lookahead=barmerge.lookahead_on)
float cur_rsi_norm = d_rsi_std != 0 ? (raw_rsi - d_rsi_mean) / d_rsi_std : 0.0 // Z
This score provides an objective measurement of current intraday momentum significance by evaluating its statistical extremity against the yearly baseline of daily momentum. This standardized approach provides the scoring engine with consistent, global contextual information, independent of the chart's current viewing timeframe.
II. CORE COMPONENTS AND TECHNICAL ANALYSIS BREAKDOWN
1. TIME AND SESSION ANALYSIS (KILLZONES AND BIAS)
The indicator visually segments the trading day based on New York (NY) trading sessions, aligning the analysis with periods of high institutional liquidity events.
Pre-Market (PRE)
• Function: Defines the range before the core market opens. This range establishes structural support and resistance levels (PMH/PML).
• Technical Implementation: Uses a dedicated Session input (ny_pre_sess). The High and Low values (pm_h_val/pm_l_val) within this session are stored and plotted for structural reference.
• Smart Extension Logic: PMH/PML lines are automatically extended until the next Pre-Market session begins, providing continuous support/resistance references overnight.
NY Killzones (AM/PM)
• Function: Highlights high-probability volatility windows where institutional liquidity is expected to be highest (e.g., NY open, lunch, NY close).
• Technical Implementation: Separate session inputs (kz_ny_am, kz_ny_pm) are utilized to draw translucent background fills, providing a clear visual cue for timing.
Market Regime Bias
• Function: Determines the initial directional premise for the trading day. The bias is confirmed when the price breaks either the Pre-Market High (PMH) or the Pre-Market Low (PML).
• Technical Implementation: Involves the comparison of the close price against the predefined structural levels (check_h for PMH, check_l for PML). The variable active_bias is set to Bullish or Bearish upon confirmed breakout.
Trend Bar Coloring
• Function: Applies a visual cue to the bars based on the established regime (Bullish=Cyan, Bearish=Red). This visual filter helps mitigate noise from counter-trend candles.
• Technical Implementation: The Pine Script barcolor() function is tied directly to the value of the determined active_bias.
2. VOLATILITY NORMALIZED SCORING ENGINE
The internal scoring mechanism accumulates points from multiple market factors to determine the strength and validity of a signal. The purpose is to apply a robust filtering mechanism before generating an entry.
The score accumulation logic is based on the following factors:
• Market Bias Alignment (+3 Points): Points are awarded for conformance with the determined active_bias (Bullish/Bearish).
• VWAP Alignment (+2 Points): Assesses the position of the current price relative to the Volume-Weighted Average Price (VWAP). Alignment suggests conformity with the average institutional transaction price.
• Volume Anomaly (+2 Points): Detects a price move accompanied by an abnormally high relative volume (odd_vol_spike). This suggests potential institutional participation or significant order flow.
• VIX Integration (+2 Points): A score derived from the CBOE VIX index, assessing overall market stability and stress. Stable VIX levels add points, while high VIX levels (stress regimes) remove points or prevent signal generation entirely.
• ML Probability Score (+3 Points): This is the core predictive engine. It utilizes a Log-Manhattan Distance Kernel to compare the current market state against historical volatility patterns. The script implements a Log-linear distance formula (log(1 + |Δ|) ). This approach mathematically dampens the impact of extreme volatility spikes (outliers), ensuring that the similarity score reflects true structural alignment rather than transient market noise.
Core Technical Logic (Z-Score Normalization)
float cur_rsi_norm = d_rsi_std != 0 ? (raw_rsi - d_rsi_mean) / d_rsi_std : 0.0
• Technical Purpose: This line calculates the Z-Score (cur_rsi_norm) of the current momentum oscillator reading (raw_rsi) by normalizing it against the mean (d_rsi_mean) and standard deviation (d_rsi_std) derived from 252 days of Daily momentum data. If the standard deviation is zero (market is perfectly flat), it safely returns 0.0 to prevent division by zero runtime errors. This allows the AI's probability score to be based on the current signal's significance within the context of the entire trading year.
3. EXECUTION AND RISK MANAGEMENT (ATR MODEL)
The indicator utilizes the Average True Range (ATR) volatility model. This helps risk management scale dynamically with market volatility by allowing users to define TP/SL distances independently based on the current ATR.
Stop Loss Multiplier (sl_mult)
• Function: Sets the Stop Loss (SL) distance as a configurable multiple of the current ATR (e.g., 1.5 × ATR).
• Technical Logic: The price level is calculated as: last_sl_price := close - (atr_val * sl_mult). The mathematical sign is reversed for short trades.
Take Profit Multiplier (tp_mult)
• Function: Sets the Take Profit (TP) distance as a configurable multiple of the current ATR (e.g., 3.0 × ATR).
• Technical Logic: The price level is calculated as: last_tp_price := close + (atr_val * tp_mult). The mathematical sign is reversed for short trades.
Structural SL Option
• Function: Provides an override to the ATR-based SL calculation. When enabled, it forces the Stop Loss to the Pre-Market High/Low (PMH/PML) level, aligning the stop with a key institutional structural boundary.
• Technical Logic: The indicator checks the use_struct_sl input. If true, the calculated last_sl_price is overridden with either pm_h_val or pm_l_val, dependent on the specific trade direction.
Trend Continuation Logic
• Function: Enables signal generation in established, strong trends (typically in the Afternoon session) based on follow-through momentum (a new high/low of the previous bar) combined with a high Signal Score, rather than exclusively relying on the initial PMH/PML breakout.
• Technical Logic: For a long signal, the is_cont_long logic specifically requires checks like active_bias == s_bull AND close > high , confirming follow-through momentum within the established regime.
Smart Snapping & Cleanup (16:00 Market Close)
• Function: To maintain chart cleanliness, all trade boxes (TP/SL), AI Prediction zones, Killzone overlays (NY AM/PM), and Liquidity lines (PDH/PDL) are automatically "snapped" and cut off precisely at 16:00 NY Time (Market Close).
• Technical Logic: When is_market_close condition is met (hour == 16 and minute == 0), the script executes cleanup logic that:
◦ Closes active trades and evaluates final P&L
◦ Snaps all TP/SL box widths to current bar
◦ Truncates AI Prediction ghost boxes at market close
◦ Cuts off NY AM/PM Killzone background fills
◦ Terminates PDH/PDL line extensions
◦ Prevents visual clutter from extending into post-market sessions
4. LIQUIDITY AND STRUCTURAL ANALYSIS
The indicator plots key structural levels that serve as high-probability magnet zones or areas of potential liquidity absorption.
• Pre-Market High/Low (PMH/PML): These are the high and low established during the configured pre-market session (ny_pre_sess). They define the primary structural breakout level for the day, often serving as the initial market inflection point or the key entry level for the morning session.
• PDH (Previous Day High): The high of the calendar day immediately preceding the current bar. This represents a key Liquidity Pool; large orders are often placed above this level, making it a frequent target for stop hunts or liquidity absorption by market makers.
• PDL (Previous Day Low): The low of the calendar day immediately preceding the current bar. This also represents a key Liquidity Pool and a high-probability reversal or accumulation point, particularly during the Killzones.
FIFO Array Management
The indicator uses FIFO (First-In-First-Out) array structures to manage liquidity lines and labels, automatically deleting the oldest objects when the count exceeds 500 to comply with drawing object limits.
5. AI PREDICTION BOX (PREDICTIVE MODEL)
Function: Analyzes AI scores and volatility to project predicted killzone ranges and duration with asymmetric directional bias.
A. DIRECTIONAL BIAS (ASYMMETRIC EXPANSION)
The prediction model calculates directional probability using the ML kernel's 252-day Normalized RSI (Z-Score) and Relative Volume (RVOL). The prediction box dynamically adjusts its range based on this probability to provide immediate visual feedback on high-probability direction.
Bullish Scenario (ml_prob > 1.0):
• Upper Range: Expands significantly (1.5x multiplier) to show the aggressive upside target
• Lower Range: Tightens (0.5x multiplier) to show the invalidation level
• Visual Intent: The box is visibly skewed upward, immediately communicating bullish bias without requiring numerical analysis.
Bearish Scenario (ml_prob < -1.0):
• Upper Range: Tightens (0.5x multiplier) to show the invalidation level
• Lower Range: Expands significantly (1.5x multiplier) to show the aggressive downside target
• Visual Intent: The box is visibly skewed downward, immediately communicating bearish bias.
Neutral Scenario (-1.0 < ml_prob < 1.0):
Both ranges use balanced multipliers, creating a symmetrical box that indicates uncertainty.
B. DYNAMIC VOLATILITY BOOSTER (SESSION-BASED ADAPTATION)
The prediction box adjusts its volatility multiplier based on the current session and market conditions to account for intraday volatility patterns.
AM Session (Morning: 07:00-12:00):
• Base Multiplier: 1.0x (Neutral Base)
• Logic: Morning sessions often contain false breakouts and noise. The base multiplier starts neutral to avoid over-projecting during consolidation.
• Trend Booster: Multiplier jumps to 1.5x when:
Price > London Session Open AND AI is Bullish (ml_prob > 0), OR
Price < London Session Open AND AI is Bearish (ml_prob < 0)
• Logic: When the London trend (typically 03:00-08:00 NY time) aligns with the AI model's directional conviction, the indicator aggressively targets higher volatility expansion. This filters for "institutional follow-through" rather than random morning chop.
PM Session (Afternoon: 13:00-16:00):
• Fixed Multiplier: 1.8x
• Logic: The PM session, particularly the 13:30-16:00 ICT Silver Bullet window, often contains the "True Move" of the day. A higher baseline multiplier is applied to emphasize this session's significance over morning noise.
Safety Floor:
A minimum range of 0.2% of the current price is enforced regardless of volatility conditions.
• Purpose: Maintains the prediction box visibility during extreme low-volatility consolidation periods where ATR might collapse to near-zero values.
Volatility Clamp Protection:
Maximum volatility is capped at three times the current ATR value. During flash crashes, circuit breaker halts, or large overnight gaps, raw volatility calculations can spike to extreme levels. This clamp prevents prediction boxes from expanding to unrealistic widths.
Technical Implementation:
f_get_ai_multipliers(float _prob) =>
float _abs_prob = math.abs(_prob)
float _range_mult = 1.0
float _dur_mult = 1.0
if _abs_prob > 30
_range_mult := 1.8
else if _abs_prob > 10
_range_mult := 1.2
else
_range_mult := 0.7
C. PRACTICAL INTERPRETATION
• Wide Upper Range + Tight Lower Range: Strong bullish conviction. The model expects significant upside with limited downside risk.
• Tight Upper Range + Wide Lower Range: Strong bearish conviction. The model expects significant downside with limited upside.
• Symmetrical Range: Neutral/uncertain market. Wait for directional confirmation before entry.
• Large Box (Extended Duration): High-confidence prediction expecting sustained movement.
• Small Box (Short Duration): Low-confidence or choppy conditions. Expect quick resolution.
III. PRACTICAL USAGE GUIDE: METHODOLOGY AND EXECUTION
A. ESTABLISHING TRADING CONTEXT (THE THREE CHECKS)
The primary goal of the dashboard is to filter out low-probability trade setups before they occur.
• Timeframe Selection: Although the core AI is normalized to the Daily context, the indicator performs optimally on intraday timeframes (e.g., 5m, 15m) where session-based volatility is most pronounced.
• PHASE Check (Timing): Always confirm the current phase. The highest probability signals typically occur within the visually highlighted NY AM/PM Killzones because this is when institutional liquidity and volume are at their peak. Signals outside these zones should be treated with skepticism.
• MARKET REGIME Check (Bias): Ensure the signal (BUY/SELL arrow) aligns with the established MARKET REGIME bias (BULLISH/BEARISH). Counter-bias signals are technically allowed if the score is high, but they represent a higher risk trade.
• VIX REGIME Check (Risk): Review the VIX REGIME for overall market stress. Periods marked DANGER (high VIX) indicate elevated volatility and market uncertainty. During DANGER regimes, reducing position size or choosing a wider SL Multiplier is advisable.
B. DASHBOARD INTERPRETATION (THE REAL-TIME STATUS DISPLAY)
The indicator features a non-intrusive dashboard that provides real-time, context-aware information based on the core analytical engines.
PHASE: (PRE-MARKET, NY-AM, LUNCH, NY-PM)
• Meaning: Indicates the current institutional session time. This is derived from the customizable session inputs.
• Interpretation: Signals generated during NY-AM or NY-PM (Killzones) are generally considered higher-probability due to increased institutional participation and liquidity.
MARKET REGIME: (BULLISH, BEARISH, NEUTRAL)
• Meaning: The established directional bias for the trading day, confirmed by the price breaking above the Pre-Market High (PMH) or below the Pre-Market Low (PML).
• Interpretation: Trading with the established regime (e.g., taking a BUY signal when the regime is BULLISH) is the primary method. NEUTRAL indicates that the PMH/PML boundary has not yet been broken, suggesting market ambiguity.
VIX REGIME: (STABLE, DANGER)
• Meaning: A measure of overall market stress and stability, based on the CBOE VIX index integration. The thresholds (20.0 and 35.0 default) are customizable by the user.
• Interpretation: STABLE indicates stable volatility, favoring momentum trades. DANGER (VIX > 35.0) indicates extreme stress; signals generated in this environment require caution and often necessitate smaller position sizing.
SIGNAL SCORE: (0 to 10+ Points)
• Meaning: The accumulated score derived from the VOLATILITY NORMALIZED AI SCORING ENGINE, factoring in bias, VWAP alignment, volume, and the Z-Score probability.
• Interpretation: The indicator generates a signal when this score meets or exceeds the Minimum Entry Score (default 3). A higher score (e.g., 7+) indicates greater statistical confluence and a stronger potential entry.
AI PROBABILITY: (Bull/Bear %)
• Meaning: Directional probability derived from the ML kernel, expressed as a percentage with Bull/Bear label.
• Interpretation: Higher absolute values (>20%) indicate stronger directional conviction from the ML model.
LIVE METRICS SECTION:
• STATUS: Shows current trade state (LONG, SHORT, or INACTIVE)
• ENTRY: Displays the entry price for active trades
• TARGET: Shows the calculated Take Profit level
• ROI | KILL ZONE:
◦ For Active Trades: Displays real-time P&L percentage during NY session hours.
◦ At Market Close (16:00 NY): Since this is a NY session-specific indicator, any active position is automatically evaluated and closed at 16:00. The final result (VALIDATED or INVALIDATED) is determined based on whether the trade reached profit or loss at market close.
◦ Result Persistence: The killzone result (VALIDATED/INVALIDATED) remains displayed on the dashboard until the next NY AM KILLZONE session begins, providing a clear performance reference for the previous trading day.
Note: If a trade is still trending at 16:00, it will be force-closed and evaluated at that moment, as the indicator operates strictly within NY trading hours.
C. SIGNAL GENERATION AND ENTRY LOGIC
The indicator generates signals based on two distinct technical setups, both of which require the accumulated SIGNAL SCORE to be above the configured Minimum Entry Score.
Breakout Entry
• Trigger Condition: Price closes beyond the Pre-Market High (PMH) or Low (PML).
• Rationale: This setup targets the initial directional movement for the day. A breakout confirms the institutional bias by decisively breaking the first major structural boundary, making the signal high-probability.
Continuation Entry
• Trigger Condition: The market is already in an established regime (e.g., BULLISH), and the price closes above the high (or below the low) of the previous bar, while the SIGNAL SCORE remains high. Requires the Allow Trend Continuation parameter to be active.
• Rationale: This setup targets follow-through trades, typically in the afternoon session, capturing momentum after the morning's direction has been confirmed. This filters for sustainability in the established trend.
Execution: Execute the trade immediately upon the close of the bar that prints the BUY or SELL signal arrow.
D. MANAGING RISK AND EXITS
1. RISK PARAMETER SELECTION
The indicator immediately draws the dynamic TP/SL zones upon entry.
• Volatility-Based (Recommended Default): By setting the SL Multiplier (e.g., 1.5) and the TP Multiplier (e.g., 3.0), the indicator enforces a constant, dynamically sized risk-to-reward ratio (e.g., 1:2 in this example). This helps that risk management scales proportionally with the current market volatility (ATR).
• Structural Override: Selecting the Use Structural SL parameter fixes the stop-loss not to the ATR calculation, but to the more significant structural level of the PMH or PML. This is utilized by traders who favor institutional entry rules where the stop is placed behind the liquidity boundary.
2. EXIT METHODS
• Hard Exit: Price hits the visual TP or SL box boundary.
• Soft Exit (Momentum Decay Filter): If the trade is active and the SIGNAL SCORE drops below the Exit Score Threshold (default 3), it indicates that the momentum supporting the trade has significantly collapsed. This serves as a momentum decay filter, prompting the user to consider a manual early exit even if the SL/TP levels have not been hit, thereby preserving capital during low-momentum consolidation.
• Market Close Auto-Exit: At 16:00 NY time, any active trade is automatically closed and classified as VALIDATED (profit) or INVALIDATED (loss) based on current price vs. entry price.
IV. PARAMETER REFERENCE AND CONFIGURATION
A. GLOBAL SETTINGS
• Language (String, Default: English): Selects the language for the dashboard and notification text. Options: English, Korean, Chinese, Spanish, Portuguese, Russian, Ukrainian, Vietnamese.
B. SESSION TIMES (3 BOX SYSTEM)
• PRE-MARKET (Session, Default: 0800-0930): Defines the session range used for Pre-Market High/Low (PMH/PML) structural calculation.
• REGULAR (Morning) (Session, Default: 0930-1200): Defines the core Morning trading session.
• AFTERNOON (PM) (Session, Default: 1300-1600): Defines the main Afternoon trading session.
• Timezone (String, Default: America/New_York): Sets the timezone for all session and time-based calculations.
C. NY KILLZONES (OVERLAYS)
• Show NY Killzones (Bool, Default: True): Toggles the translucent background fills that highlight high-probability trading times (Killzones).
• NY AM Killzone (Session, Default: 0700-1000): Defines the specific time window for the first key liquidity surge (Open overlap).
• NY PM Killzone (Session, Default: 1330-1600): Defines the afternoon liquidity window, aligned with the ICT Silver Bullet and PM Trend entry timing.
• Allow Entry in Killzones (Bool, Default: True): Enables or disables signal generation specifically during the defined Killzone hours.
• Activate AI Prediction Box (Bool, Default: True): Toggles the drawing of the predicted target range boxes on the chart.
D. CORE SCORING ENGINE
• Minimum Entry Score (Int, Default: 3): The lowest accumulated score required for a Buy/Sell signal to be generated and plotted.
• Allow Trend Continuation (Bool, Default: True): Enables the secondary entry logic that fires signals based on momentum in an established trend.
• Force Ignore Volume (Bool, Default: False): Overrides the volume checks in the scoring engine. Useful for markets where volume data is unreliable or nonexistent.
• Force Show Signals (Ignore Score) (Bool, Default: False): Debug mode that displays all signals regardless of score threshold.
• Integrate CBOE:VIX (Bool, Default: True): Enables the connection to the VIX index for market stress assessment.
• Stable VIX (<) (Float, Default: 20.0): VIX level below which market stress is considered low (increases score).
• Stress VIX (>) (Float, Default: 35.0): VIX level above which market stress is considered high (decreases score/flags DANGER).
• Use ML Probability (Bool, Default: True): Activates the volatility-normalized AI Z-Score kernel. Disabling this removes the cross-timeframe normalization filter.
• Max Learning History (Int, Default: 2000): Maximum number of bars stored in the ML training arrays.
• Normalization Lookback (252 Days) (Int, Default: 252): The number of DAILY bars used to calculate the Z-Score mean and standard deviation (representing approximately 1 year of data).
E. RISK MANAGEMENT (ATR MODEL)
• Use Structural SL (Bool, Default: False): Overrides the ATR-based Stop Loss distance to use the Pre-Market High/Low as the fixed stop level.
• Stop Loss Multiplier (x ATR) (Float, Default: 1.5): Defines the Stop Loss distance in multiples of the current Average True Range (ATR).
• Take Profit Multiplier (x ATR) (Float, Default: 3.0): Defines the Take Profit distance in multiples of the current Average True Range (ATR).
• Exit Score Threshold (<) (Int, Default: 3): The minimum score below which an active trade is flagged for a Soft Exit due to momentum collapse.
F. VISUAL SETTINGS
• Show Dashboard (Bool, Default: True): Toggles the real-time data panel.
• Show NY Killzones (Bool, Default: True): Toggles killzone background fills.
• Show TP/SL Zones (Bool, Default: True): Toggles the drawing of Take Profit and Stop Loss boxes.
• Show Pre-Market Extensions (Bool, Default: True): Extends PM High/Low lines across the entire chart for support/resistance reference.
• Activate AI Prediction Box (Bool, Default: True): Enable or disable the predictive range projection.
• Light Mode Optimization (Bool, Default: True): Toggles dashboard and plot colors for optimal visibility on white (light) chart backgrounds.
• Enforce Trend Coloring (Bool, Default: True): Forces candle colors based on Market Regime (Bullish=Cyan, Bearish=Pink) to emphasize trend direction.
• Label Size (String, Default: Normal): Options: Tiny, Small, Normal.
G. LIQUIDITY POOLS (PDH/PDL)
• Show Liquidity Lines (Bool, Default: True): Toggles the display of the Previous Day High (PDH) and Low (PDL) lines.
• Liquidity High Color (Color, Default: Green): Color setting for the PDH line.
• Liquidity Low Color (Color, Default: Red): Color setting for the PDL line.
🔔 ALERT CONFIGURATION GUIDE
The indicator is equipped with specific alert conditions.
How to Set Up an Alert:
Click the "Alert" (Clock icon) in the top TradingView toolbar.
Select "Market Regime NY Session " from the Condition dropdown menu.
Choose one of the specific trigger conditions below depending on your strategy:
🚀 Available Alert Conditions
1. BUY (Long Entry)
Trigger: Fires immediately when a confirmed Bullish Setup is detected.
Conditions: Market Bias is Bullish (or valid Continuation) + Signal Score ≥ Minimum Entry Score.
Usage: Use this alert to open new Long positions or close existing Short positions.
2. SELL (Short Entry)
Trigger: Fires immediately when a confirmed Bearish Setup is detected.
Conditions: Market Bias is Bearish (or valid Continuation) + Signal Score ≥ Minimum Entry Score.
Usage: Use this alert to open new Short positions or close existing Long positions.
V. IMPORTANT TECHNICAL LIMITATIONS
⚠️ Intraday Only (Timeframe Compatibility)
This indicator is strictly designed for Intraday Timeframes (1m to 4h).
Daily/Weekly Charts: The session logic (e.g., "09:30-16:00") cannot function on Daily bars because a single bar encompasses the entire session. Session boxes, TP/SL zones, and AI prediction boxes will NOT draw on the Daily timeframe. Only the PDH/PDL liquidity lines remain visible on Daily charts. This is expected behavior, not a limitation.
Maximum Supported Timeframe: All visual components (session boxes, killzone overlays, TP/SL zones, AI prediction boxes) are displayed up to the 4-hour timeframe. Above this timeframe, only PDH/PDL lines and the dashboard remain functional.
⚠️ Drawing Object Limit (Max 500)
A single script can display a maximum of 500 drawing objects (boxes/lines) simultaneously.
On lower timeframes (e.g., 1-minute), where many signals and session boxes are generated, older history (typically beyond 10-14 days) will automatically disappear to make room for new real-time data.
For deeper historical backtesting visualization, switch to higher timeframes (e.g., 15m, 1h).
The indicator implements FIFO array management to comply with this limit while maintaining the most recent and relevant visual data.
VI. PRACTICAL TRADING TIPS AND BEST PRACTICES
• Killzone Confirmation: The highest statistical validity is observed when a high-score signal occurs directly within a visible NY AM/PM Killzone. Use the Killzones as a strict time filter.
• Liquidity Awareness (PDH/PDL): Treat the Previous Day High (PDH) and Low (PDL) lines as magnets. If your dynamic Take Profit (TP) is placed just above PDH, consider adjusting your target slightly below PDH or utilizing the Soft Exit, as liquidity absorption at these levels often results in sudden, sharp reversals that stop out a trade just before the target is reached.
• VIX as a Position Sizer: During DANGER VIX regimes, the resulting high volatility means the ATR value will be large. It is prudent to either reduce the SL Multiplier or, more commonly, reduce the overall position size to maintain a constant currency risk exposure per trade.
• Continuation Filter Timing: Trend Continuation signals are most effective during the Afternoon (PM) session when the morning's directional breakout has had time to establish a strong, clear, and sustainable trend. Avoid using them in the initial AM session when the direction is still being contested.
• 16:00 Market Close Rule: All trades, boxes, and lines are automatically cleaned up at 16:00 NY time. This prevents overnight chart clutter and maintains visual clarity.
VII. DISCLAIMER & RISK WARNINGS
• Educational Purpose Only
This indicator, including all associated code, documentation, and visual outputs, is provided strictly for educational and informational purposes. It does not constitute financial advice, investment recommendations, or a solicitation to buy or sell any financial instruments.
• No Guarantee of Performance
Past performance is not indicative of future results. All metrics displayed on the dashboard (including "ROI" and trade results) are theoretical calculations based on historical data. These figures do not account for real-world trading factors such as slippage, liquidity gaps, spread costs, or broker commissions.
• High-Risk Warning
Trading cryptocurrencies, futures, and leveraged financial products involves a substantial risk of loss. The use of leverage can amplify both gains and losses. Users acknowledge that they are solely responsible for their trading decisions and should conduct independent due diligence before executing any trades.
• Software Limitations
The software is provided "as is" without warranty. Users should be aware that market data feeds on analysis platforms may experience latency or outages, which can affect signal generation accuracy.

CAP - CSI [Auto-MTF]The CAP - CSI is a Digital Signal Processing (DSP) tool based on the principles of Lars von Thienen’s "Dynamic Cycles." While traditional oscillators often fail in trending markets by staying "pinned" at extremes, the CSI uses a recursive dual-thrust processor to isolate the underlying market rhythm, helping traders identify when a cycle is genuinely exhausted.
Core Methodology
This script implements a Cycle Swing Momentum processor. It calculates the difference between short-term and long-term "thrusts" to extract the dominant cycle from price action. Unlike static indicators, it uses Dynamic Percentile Banding to adapt its overbought and oversold levels based on the market's recent "cyclic memory."
Key Features
Pivot Point Detection: Identifies exhaustion when the CSI extends outside its dynamic bands and begins to pivot back toward the mean.
Trend-Aware Coloring: The area fill uses slope-based logic to differentiate between "Rising/Falling" momentum and "Bullish/Bearish" strong zones.
HTF (5x): Built-in logic to define the larger cycle trend. I recommend using a 5x multiplier (e.g., viewing 4H cycles on a 1H chart) to ensure you are trading with the macro flow.
Zero Line Equilibrium: Clear visualization of the cycle's position relative to its center-point to determine the current market regime.
The "Trending" Challenge
A common pitfall with DSP-based cycle tools is that they can generate "phantom" signals during powerful, linear trending conditions. This script is my attempt to solve that by integrating HTF confluence and slope-based filtering. It is specifically optimized for:
Futures: ES, NQ, RTY, and GC.
US Equities: (NVDA, TSLA, etc.).
Additional tip, search for Strong relative strength Symbols, I've created this script : CAP - Mansfield Relative Strength, but there are many there "Mansfield Relative Strength" indicators available.
Why I am sharing this
This is an ongoing project. I am releasing this to the public to connect with other traders interested in Lars von Thienen’s work or John Ehlers’ DSP techniques. My goal is to collaborate with the community to refine the processor further and build a consistent, profitable system that can distinguish between a cycle turn and a trend continuation.
